OpenTelemetry
Requirements:
- docker-compose
Prepare setup
Create a docker-compose.yaml and otel-collector-config.yml file as seen below in a folder.
name: renovate-otel-demo

services:
  # Jaeger for storing traces
  jaeger:
    image: jaegertracing/jaeger:2.16.0
    ports:
      - '16686:16686' # Web UI
      - '4317' # OTLP gRPC
      - '4318' # OTLP HTTP

  # Prometheus for storing metrics
  prometheus:
    image: prom/prometheus:v3.10.0
    ports:
      - '9090:9090' # Web UI
      - '4318' # OTLP HTTP
    command:
      - --web.enable-otlp-receiver
      # Mirror these flags from the Dockerfile, because `command` overwrites the default flags.
      # https://github.com/prometheus/prometheus/blob/5b5fee08af4c73230b2dae35964816f7b3c29351/Dockerfile#L23-L24
      - --config.file=/etc/prometheus/prometheus.yml
      - --storage.tsdb.path=/prometheus

  otel-collector:
    # Using the Contrib version to access the spanmetrics connector.
    # If you don't need the spanmetrics connector, you can use the standard version
    image: otel/opentelemetry-collector-contrib:0.148.0
    volumes:
      - ./otel-collector-config.yml:/etc/otelcol-contrib/config.yaml
    ports:
      - '4318:4318' # OTLP HTTP ( exposed to the host )
      - '4317:4317' # OTLP gRPC ( exposed to the host )
    depends_on:
      - jaeger
      - prometheus
receivers:
  otlp:
    protocols:
      grpc:
        endpoint: 0.0.0.0:4317
      http:
        endpoint: 0.0.0.0:4318

exporters:
  otlp/jaeger:
    endpoint: jaeger:4317
    tls:
      insecure: true
  otlphttp/prometheus:
    endpoint: http://prometheus:9090/api/v1/otlp
  debug:
  # verbosity: normal

connectors:
  spanmetrics:
    histogram:
      exponential:
    dimensions:
      - name: http.method
        default: GET
      - name: http.status_code
      - name: http.host
    dimensions_cache_size: 1000
    aggregation_temporality: 'AGGREGATION_TEMPORALITY_CUMULATIVE'
    exemplars:
      enabled: true

processors:
  batch:

extensions:
  health_check:
  pprof:
  zpages:

service:
  extensions: [pprof, zpages, health_check]
  pipelines:
    traces:
      receivers: [otlp]
      exporters:
        - otlp/jaeger
        # Send traces to connector for metrics calculation
        - spanmetrics
        # Enable debug exporter to see traces in the logs
        #- debug
      processors: [batch]

    metrics:
      receivers:
        - otlp # Receive metrics from Renovate.
        - spanmetrics # Receive metrics calculated by the spanmetrics connector.
      processors: [batch]
      exporters:
        - otlphttp/prometheus
        # Enable debug exporter to see metrics in the logs
        # - debug
Start setup using this command inside the folder containing the files created in the earlier steps:
docker-compose up
This command will start:
- an OpenTelemetry Collector
- an instance of Jaeger for traces
- and Prometheus
Jaeger will be now reachable under http://localhost:16686.
Run Renovate with OpenTelemetry
To start Renovate with OpenTelemetry enabled run following command, after pointing to your config.js config file:
docker run \
  --rm \
  --network renovate-otel-demo_default \
  -e OTEL_EXPORTER_OTLP_ENDPOINT=http://otel-collector:4318 \
  -v "/path/to/your/config.js:/usr/src/app/config.js" \
  renovate/renovate:latest
You should now see trace_id and span_id fields in the logs.
 INFO: Repository finished (repository=org/example)
       "durationMs": 5574,
       "trace_id": "f9a4c33852333fc2a0fbdc163100c987",
       "span_id": "4ac1323eeaee
Traces
Open now Jaeger under http://localhost:16686.
You should now be able to pick renovate under in the field service field.
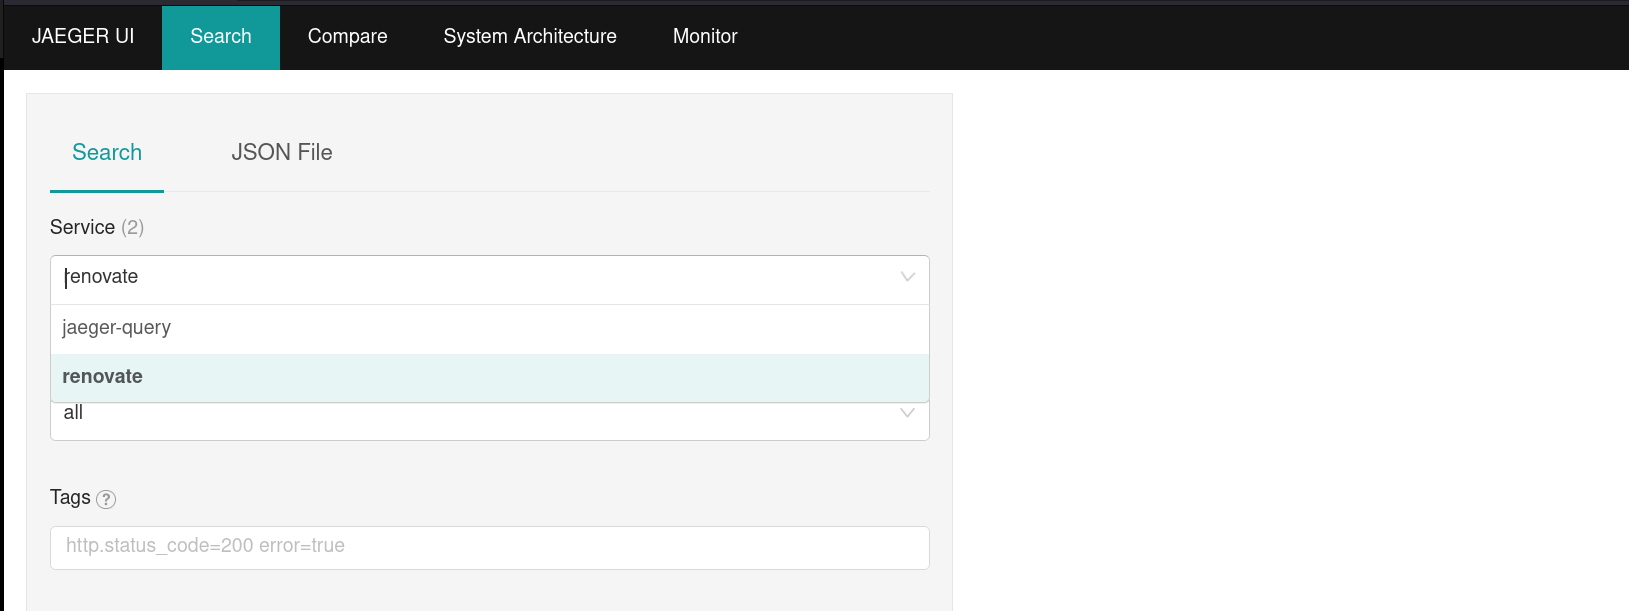
Select Find Traces to search for all Renovate traces and then select one of the found traces to open the trace view.
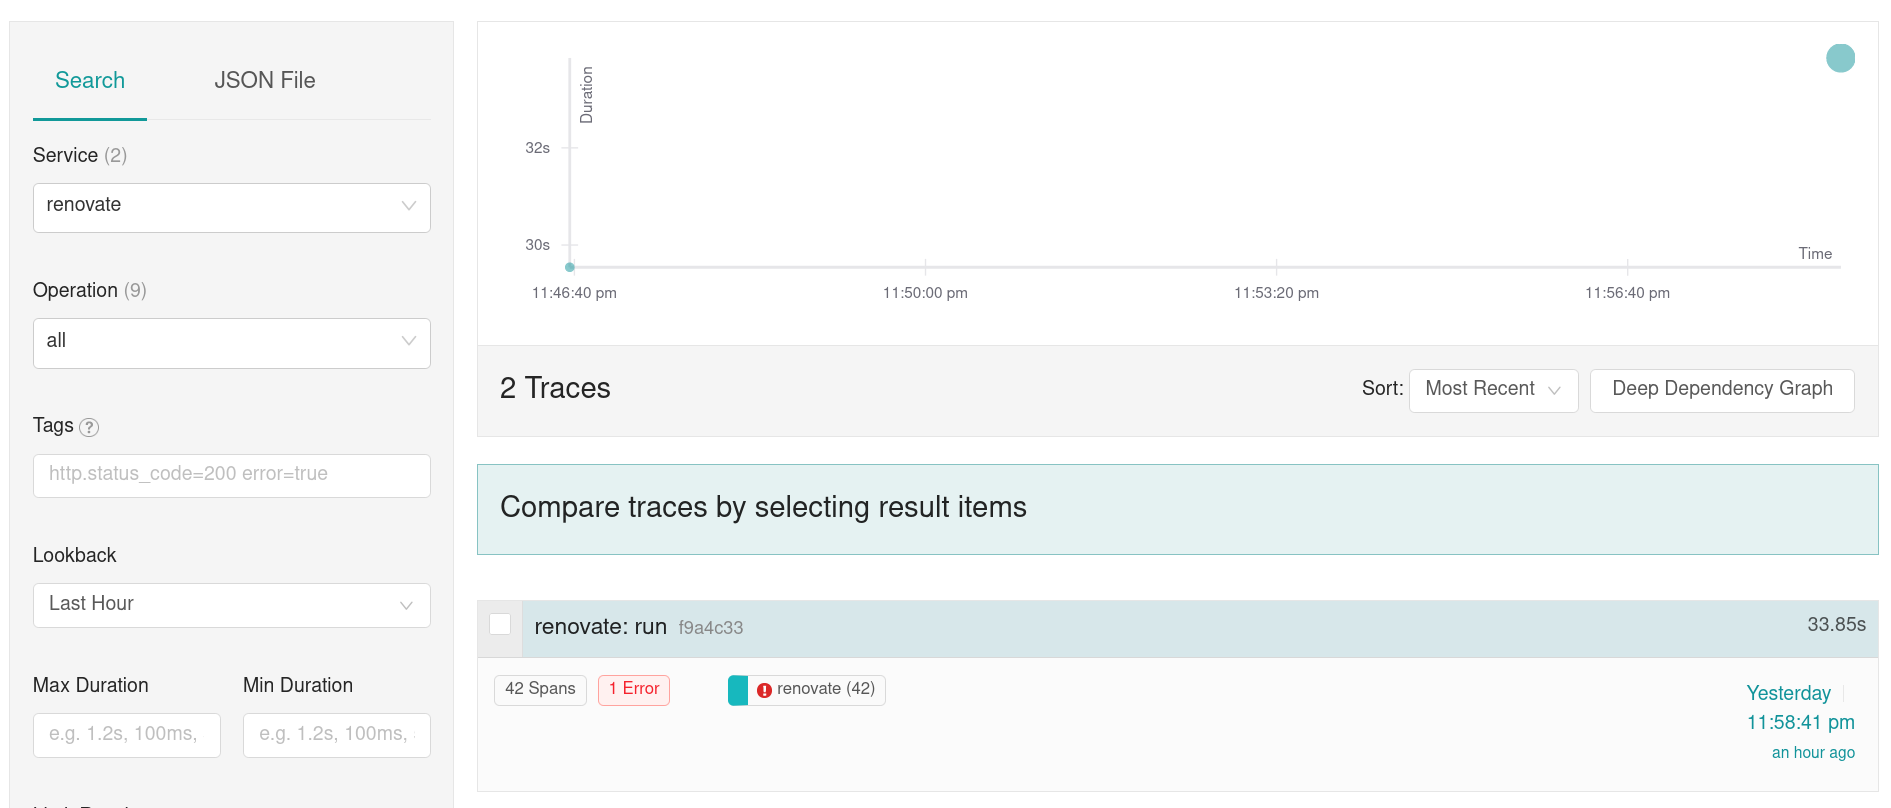
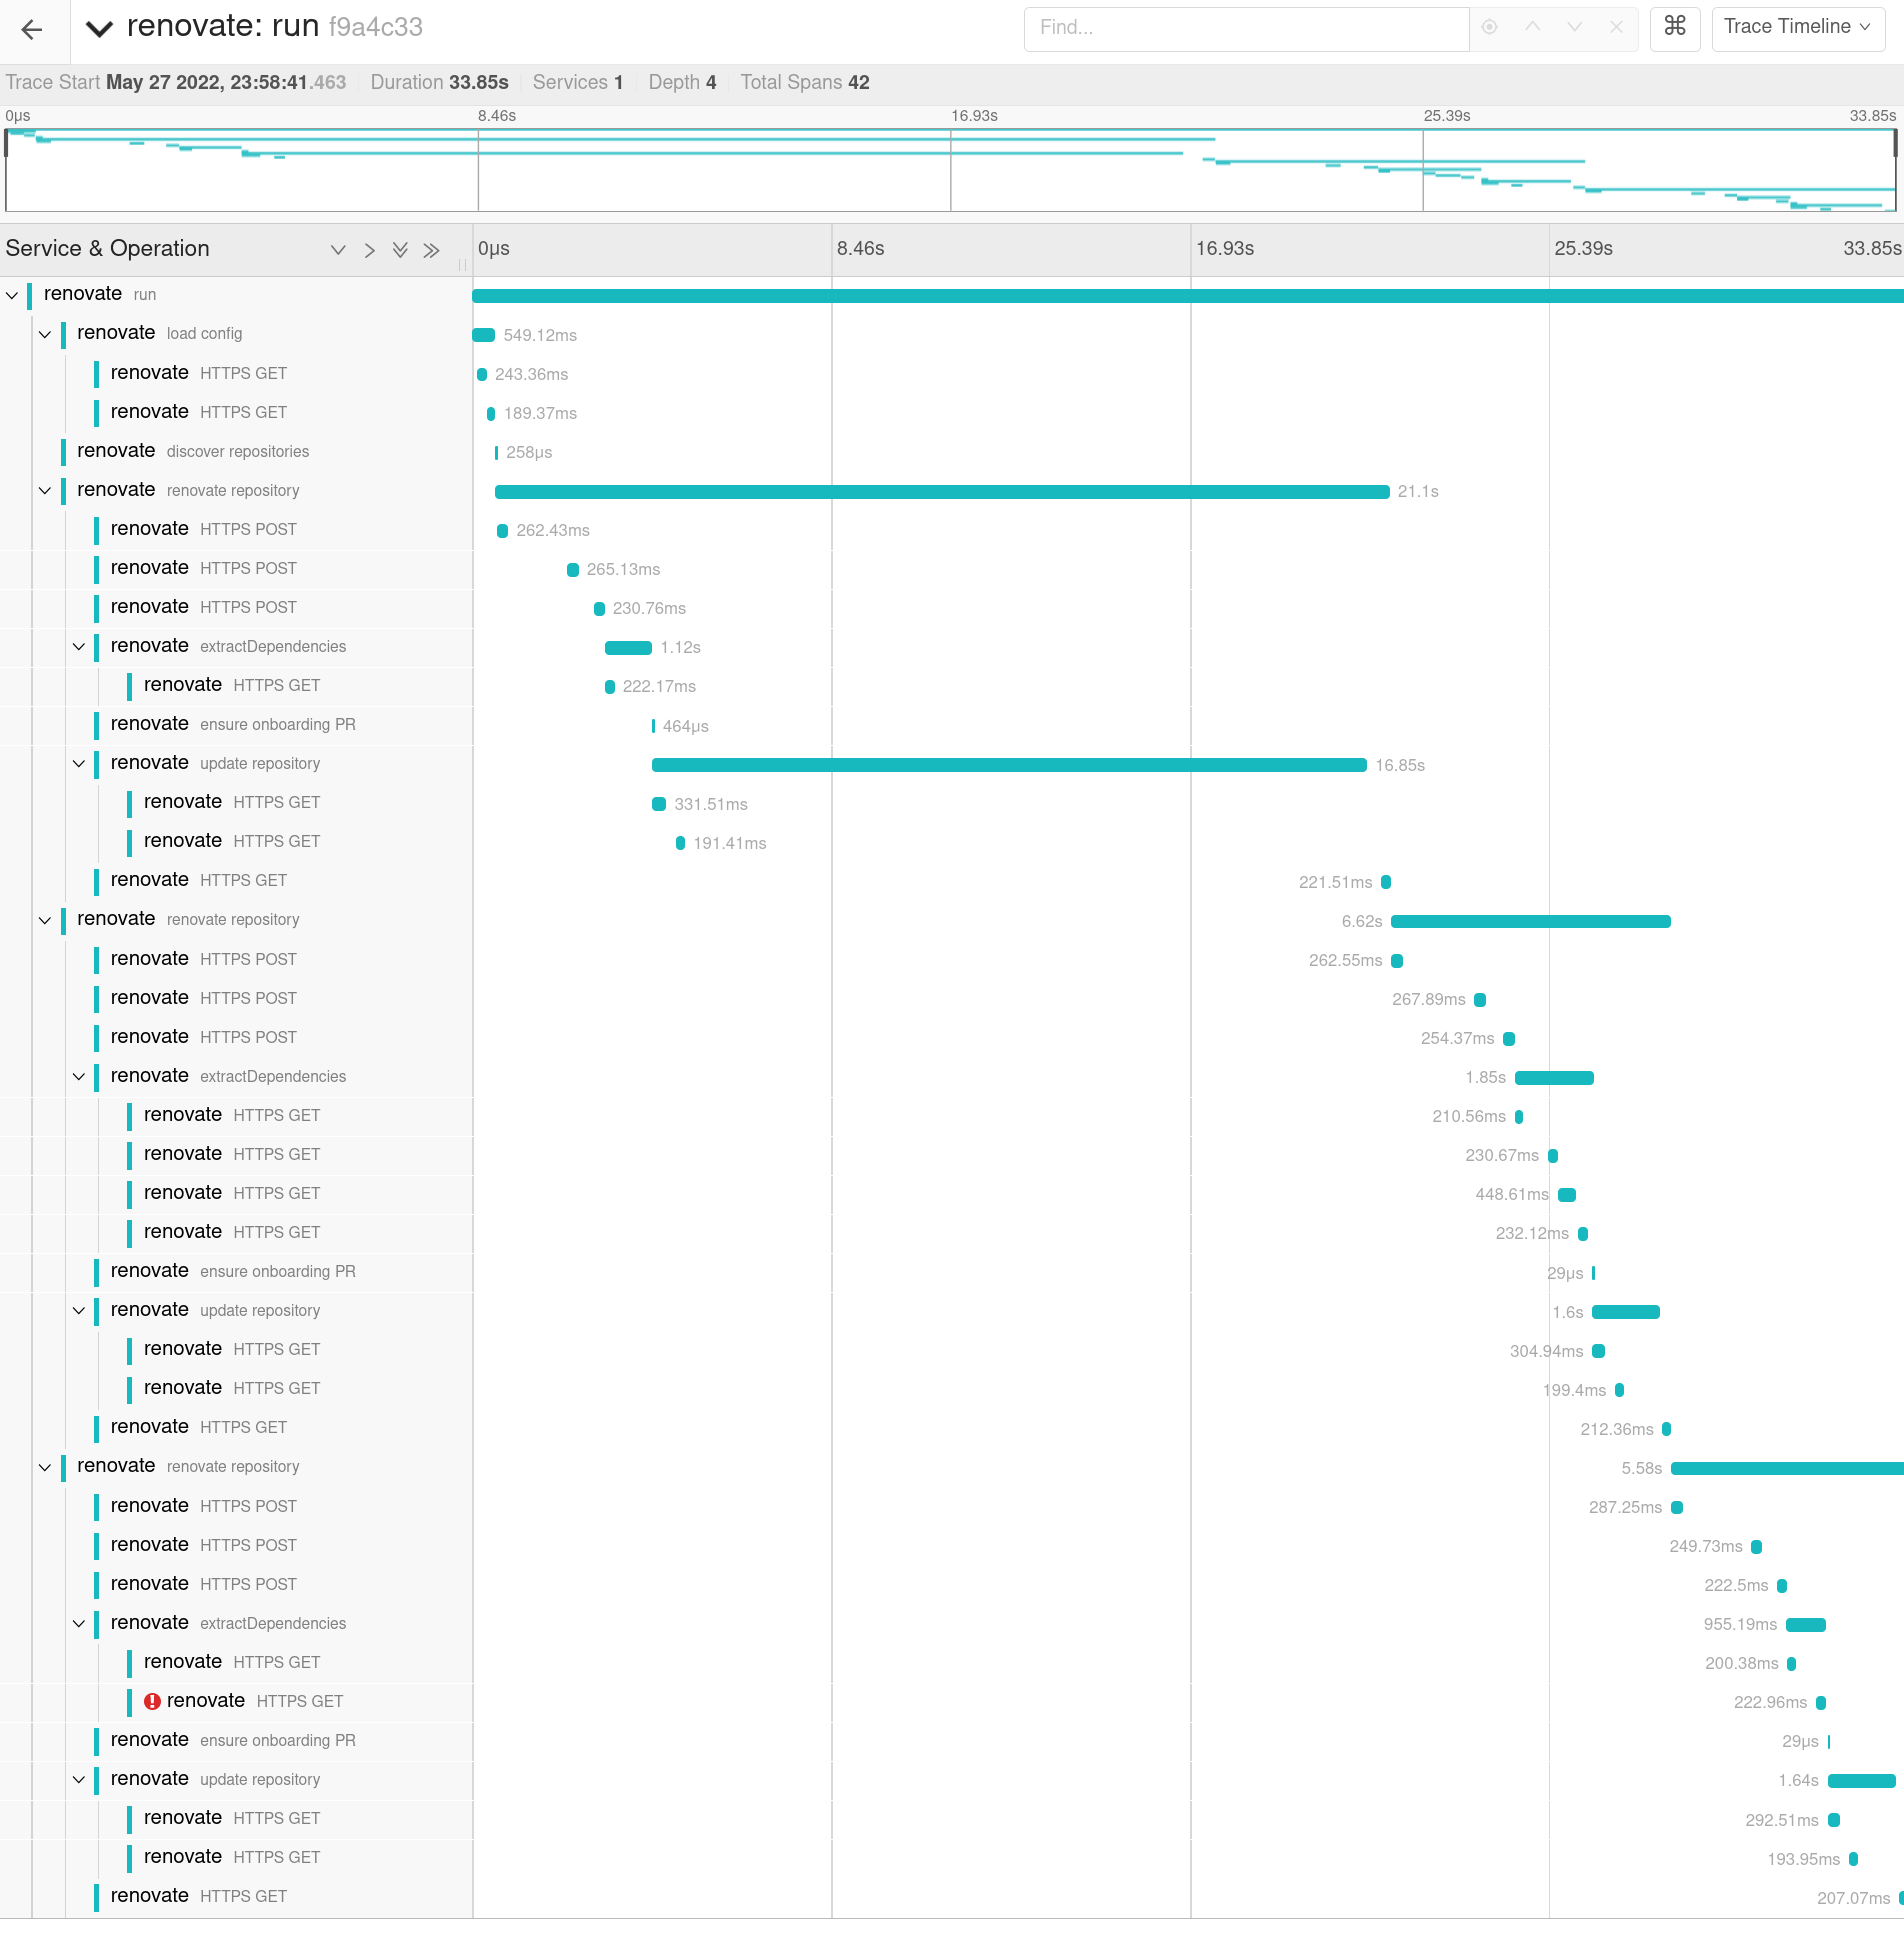
You should be able to see now the full trace view which shows more information about what is happening, such as HTTP requests, execution of commands or Git operations, and how long Renovate takes to process a given branch:
Metrics
Additional to the received traces some metrics are calculated. This is achieved using the spanmetrics connector. The previously implemented setup will produce following metrics, which pushed to Prometheus:
### Example of internal spans
traces_span_metrics_calls_total{http_method="GET", job="renovatebot.com/renovate", service_name="renovate", span_kind="SPAN_KIND_INTERNAL", span_name="repository", status_code="STATUS_CODE_UNSET"} 2
traces_span_metrics_calls_total{http_method="GET", job="renovatebot.com/renovate", service_name="renovate", span_kind="SPAN_KIND_INTERNAL", span_name="run", status_code="STATUS_CODE_UNSET"} 2

### Example of http calls from Renovate to external services
traces_span_metrics_calls_total{http_host="api.github.com:443", http_method="POST", http_status_code="200", job="renovatebot.com/renovate", service_name="renovate", span_kind="SPAN_KIND_CLIENT", span_name="POST", status_code="STATUS_CODE_UNSET"} 4


### Example histogram metrics
traces_span_metrics_duration_milliseconds_bucket{http_method="GET", job="renovatebot.com/renovate", le="8", service_name="renovate", span_kind="SPAN_KIND_INTERNAL", span_name="repository", status_code="STATUS_CODE_UNSET"} 0
...
traces_span_metrics_duration_milliseconds_bucket{http_method="GET", job="renovatebot.com/renovate", le="2000", service_name="renovate", span_kind="SPAN_KIND_INTERNAL", span_name="repository", status_code="STATUS_CODE_UNSET"} 0
traces_span_metrics_duration_milliseconds_bucket{http_method="GET", job="renovatebot.com/renovate", le="5000", service_name="renovate", span_kind="SPAN_KIND_INTERNAL", span_name="repository", status_code="STATUS_CODE_UNSET"} 1
traces_span_metrics_duration_milliseconds_bucket{http_method="GET", job="renovatebot.com/renovate", le="15000", service_name="renovate", span_kind="SPAN_KIND_INTERNAL", span_name="repository", status_code="STATUS_CODE_UNSET"} 1
traces_span_metrics_duration_milliseconds_bucket{http_method="GET", job="renovatebot.com/renovate", le="10000", service_name="renovate", span_kind="SPAN_KIND_INTERNAL", span_name="repository", status_code="STATUS_CODE_UNSET"} 1
traces_span_metrics_duration_milliseconds_bucket{http_method="GET", job="renovatebot.com/renovate", le="+Inf", service_name="renovate", span_kind="SPAN_KIND_INTERNAL", span_name="repository", status_code="STATUS_CODE_UNSET"} 1

traces_span_metrics_duration_milliseconds_sum{http_method="GET", job="renovatebot.com/renovate", service_name="renovate", span_kind="SPAN_KIND_INTERNAL", span_name="repository", status_code="STATUS_CODE_UNSET"} 4190.694209
traces_span_metrics_duration_milliseconds_count{http_method="GET", job="renovatebot.com/renovate", service_name="renovate", span_kind="SPAN_KIND_INTERNAL", span_name="repository", status_code="STATUS_CODE_UNSET"} 1
The spanmetrics connector creates two sets of metrics.
Calls metric
At first there are the traces_span_metrics_calls_total metrics.
These metrics show how often specific trace spans have been observed.
For example:
traces_span_metrics_calls_total{http_method="GET", job="renovatebot.com/renovate", service_name="renovate", span_kind="SPAN_KIND_INTERNAL", span_name="repositories", status_code="STATUS_CODE_UNSET"} 2signals that 2 repositories have been renovated.traces_span_metrics_calls_total{http_method="GET", job="renovatebot.com/renovate", service_name="renovate", span_kind="SPAN_KIND_INTERNAL", span_name="run", status_code="STATUS_CODE_UNSET"} 1represents how often Renovate has been run.
If we combine this using the PrometheusQueryLanguage ( PromQL ), we can calculate the average count of repositories each Renovate run handles.
traces_span_metrics_calls_total{span_name="repository",service_name="renovate"} / traces_span_metrics_calls_total{span_name="run",service_name="renovate"}
These metrics are generated for HTTP call spans too:
traces_span_metrics_calls_total{http_host="prometheus-community.github.io:443", http_method="GET", http_status_code="200", job="renovatebot.com/renovate", service_name="renovate", span_kind="SPAN_KIND_CLIENT", span_name="GET", status_code="STATUS_CODE_UNSET"} 5
Latency buckets
The second class of metrics exposed are the latency-focused buckets, that allow creating heatmaps.
A request is added to a backed if the latency is bigger than the bucket value (le). request_duration => le
As an example if we receive a request which need 1.533s to complete get following metrics:
traces_span_metrics_duration_milliseconds_bucket{http_host="api.github.com:443",le="0.1"} 0
traces_span_metrics_duration_milliseconds_bucket{http_host="api.github.com:443",le="1"} 0
traces_span_metrics_duration_milliseconds_bucket{http_host="api.github.com:443",le="2"} 1
traces_span_metrics_duration_milliseconds_bucket{http_host="api.github.com:443",le="6"} 1
traces_span_metrics_duration_milliseconds_bucket{http_host="api.github.com:443",le="10"} 1
traces_span_metrics_duration_milliseconds_bucket{http_host="api.github.com:443",le="100"} 1
traces_span_metrics_duration_milliseconds_bucket{http_host="api.github.com:443",le="250"} 1
traces_span_metrics_duration_milliseconds_bucket{http_host="api.github.com:443",le="9.223372036854775e+12"} 1
traces_span_metrics_duration_milliseconds_bucket{http_host="api.github.com:443",le="+Inf"} 1
traces_span_metrics_duration_milliseconds_sum{http_host="api.github.com:443"} 1.533
traces_span_metrics_duration_milliseconds_count{http_host="api.github.com:443"} 1
Now we have another request which this time takes 10s to complete:
traces_span_metrics_duration_milliseconds_bucket{http_host="api.github.com:443",le="0.1"} 0
traces_span_metrics_duration_milliseconds_bucket{http_host="api.github.com:443",le="1"} 0
traces_span_metrics_duration_milliseconds_bucket{http_host="api.github.com:443",le="2"} 1
traces_span_metrics_duration_milliseconds_bucket{http_host="api.github.com:443",le="6"} 1
traces_span_metrics_duration_milliseconds_bucket{http_host="api.github.com:443",le="10"} 2
traces_span_metrics_duration_milliseconds_bucket{http_host="api.github.com:443",le="100"} 2
traces_span_metrics_duration_milliseconds_bucket{http_host="api.github.com:443",le="250"} 2
traces_span_metrics_duration_milliseconds_bucket{http_host="api.github.com:443",le="9.223372036854775e+12"} 2
traces_span_metrics_duration_milliseconds_bucket{http_host="api.github.com:443",le="+Inf"} 2
traces_span_metrics_duration_milliseconds_sum{http_host="api.github.com:443"} 11.533
traces_span_metrics_duration_milliseconds_count{http_host="api.github.com:443"} 2
More about the functionality can be found on the Prometheus page for metric types.